
marketing strategy assignment
Critically evaluate and discuss the uses and limitations of Portfolio Analysis. Apply a model of your choice to a particular SBU or Product. What marketing strategy implications are there? Should they be followed?
acknowledgements
I would like to thank Dr. A. K. SRIVASTAVA, my course leader for Marketing Strategy for his continuing interest, encouragement, and support in helping me complete this assignment.
We are all influenced by the thoughts and ideas of other people which tend to drift into the subconscious and are not always distinguished clearly from one’s own. I have attempted to give references for sources of work by other writers but apologise to any concerned if acknowledgement has inadvertently not been recorded.
contents
I. Acknowledgements
II. List of Figures
III. Abstract
IV. Introduction
V. Portfolio Analysis Techniques
VI. Uses of Portfolio Analysis
VII. Application of Portfolio Analysis
VIII. Limitations of Portfolio Analysis
IX. Developments in Portfolio Analysis
X. Conclusion
XI. Bibliography
list of figures
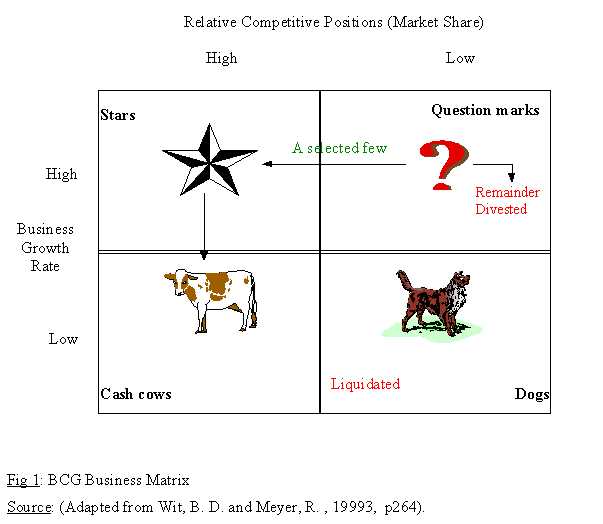
1. BCG Business Matrix
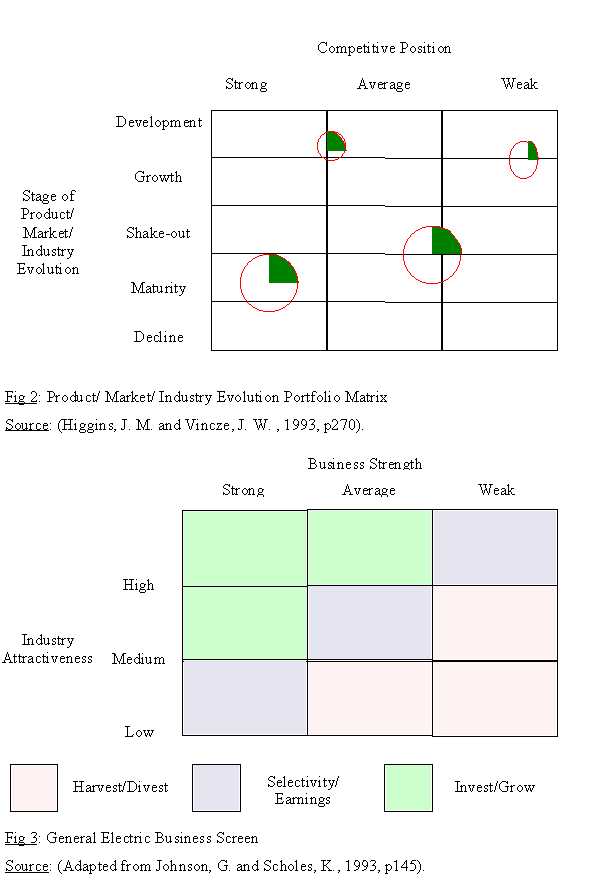
2. Product/ Market/ Industry Evolution Portfolio Matrix
3. GE Business Screen
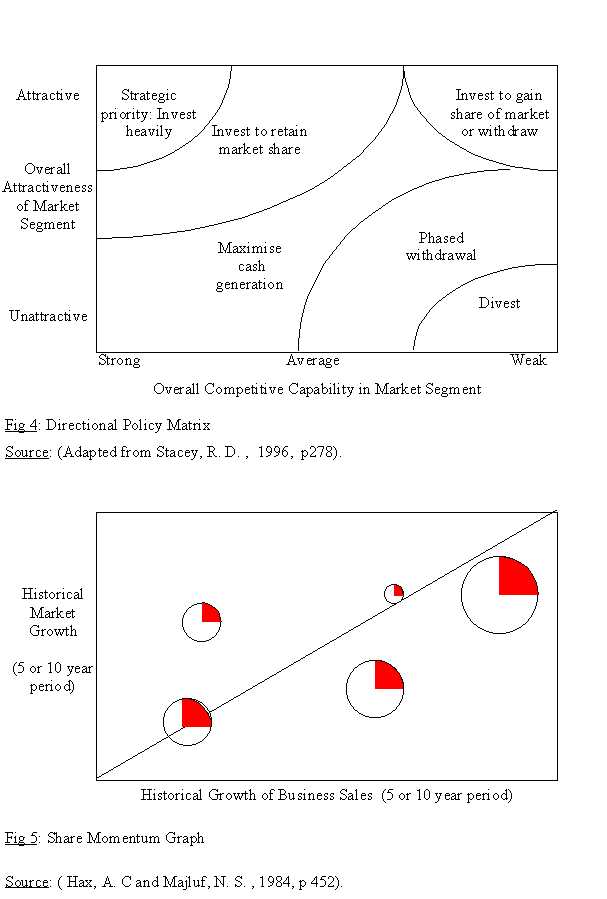
4. Directional Policy Matrix
5. Share Momentum Graph
6. BCG Matrix showing the Portfolio of ITL
7. Developments in Portfolio Analysis
abstract
The principal tasks of corporate strategists incorporate determining strategic objectives, sharing activities, transferring skills, forming alliances, establishing support functions, managing culture and determining the extent to which current and future businesses are helping or can help achieve the corporate objectives. The growing complexities and risks of modern day businesses has meant that the resources available to achieve the objectives have to be used with more caution than ever. Portfolio management techniques were introduced with the prime focus on helping corporate strategists to achieve these objectives more efficiently and effectively, and at the same time managing the overall firm synergistically.
The practical use of portfolio analysis in understanding organisation’s several business units has been analysed by applying it in a real life organisational situation. Further, the marketing implications, with respect to the present and the future scenarios, have also been emphasised. The concept and the implementation of portfolio analysis, however, suffers from certain limitations. The developments in portfolio analysis, such as the focus on linkages between the skills and the activities, and their core competencies have ensured that it still remains an invaluable tools for management. However, the success that a company gets will depend on the real commitment of the management to cope with the implications of the analysis and to stretch the elegant theory into the complex reality of the new millennium.
Introduction
The modern business world is highly complex and competitive. The resources available to any business activity are not unlimited in nature and therefore the need to make the optimum use of the scarce resources is being felt more than ever. Today most of the companies believe in the virtue of being active in more than one business, on the assumption that multi-business involvement lead to synergies that outweigh the extra costs of managing a more complex organisation. However, even in integrated, multi-activity organisations decisions have to be made concerning where to concentrate the resources, and how to mange the whole portfolio of products or business units.
Portfolio Analysis Techniques
In the late 1960s and early 1970s after the wide spate of diversification, both related and unrelated, took place companies realised the need to transfer the advantage of professional management across a broad range of businesses. Internally, however, this same diversity created a managerial gap between the corporate level and the business level. In response to the problems and prospects of managing diversity, a new generation of strategic planning approaches called portfolio analysis was introduced.
A portfolio analysis examines each of the firm’s separate ‘businesses’ as elements of its total portfolio of business. “Portfolio management techniques essentially involve plotting two or three factors against each other on a grid to arrive at some appropriate strategy.” (Higgins, J. M. and Vincze, J. W., 1993, p260). The major types of portfolio matrices that have been advocated are the Boston Consulting Group (BCG), the General Electric Business screen and the Product / Market / Industry Evolution Portfolio Matrix. Putting the portfolio planning philosophy into place takes three steps:
1. Redefining businesses into strategic business units (SBUs), which may or may not differ from operating units.
2. Classifying these SBUs on a portfolio matrix according to the variables of the particular matrix.
3. Using the framework to allocate resources to every separate unit with respect to its growth and objectives and assigning each business unit a ‘strategic mission’.
Some of the more widely used portfolio analysis techniques are shown below:
Uses of Portfolio Analysis
1. A portfolio prescription, in a simple, visual way, gives corporate management a sense of the balanced portfolio that their strategy should achieve, as well as the way to control and allocate resources to their divisions.
2. The disintegration of a firm into its constituent markets enables management to view the firm not merely as a single entity, but rather as a combination of various sub-segments.
3. Such a viewpoint enables management to develop and implement appropriate strategies for each product market unit and combine them with the firm’s overall strategic position. This helps in diagnosing the strategic position and suggests strategic direction to move from one strategic group to another.
4. The portfolio analysis techniques enables management to become cognisant of each unit’s strategic position in relation to factors such as, life-cycle, sales volume, cash contribution, strategic position relative to it’s competitors, strategic position in relation to the overall portfolio, etc.
5. The portfolio approach helps companies to maintain a balance between the activities and the skills that the organisation possesses. This ensures that no group is overstretched or underemployed.
6. Moreover, a separate unit may also be analysed on a multitude of factors by using a range of portfolio analysis techniques. Portfolio analysis can also be combined with other strategic management techniques. For example, “Royal Dutch / Shell acquires firms to add to its existing portfolio based on scenario forecasting.” (The Economist, July 22 ,1989, p62).
7. By applying the techniques on projected figures the likely changes can be easily identified and long term plans can be made accordingly.
8. A portfolio analysis helps management in considering whether each product / unit is measuring upto management’s minimum performance criteria, and in assessing the relative strengths and weaknesses of the product / unit.
9. Portfolio analysis helps management make decisions regarding centralising or decentralising and allows the corporate center to reassert its primacy in creating profit potential, but at the same time leaves SBUs with maximum operational autonomy in realising that potential.
10. Portfolio matrices also help in thinking about acquisition strategies and in finding the real costs and difficulties of an acquisition.
Application of Portfolio Analysis
The uses of portfolio analysis can be better understood by applying the technique in an organisation.
International Traders Limited (ITL), based in Dubai, UAE started its operations in the year 1962. It started its business with the trading of textiles. During the initial years of its development there was very little competition and the market was growing steadily. In the early 1980s ITL set up Cosmos Enterprises , an electronics trading firm which also served as the distributors of Sharp electronics products. With the growing influx of immigrants, especially Asians , the market for electronics and textiles continued to grow. In 1992 the group acquired Universal Garments Factory, Ajman to add to its portfolio of businesses. Later, a business unit dealing in corporate gift items was also started. Today the group, under the chairmanship of Ram Buxani, is recognised as a leading business house.
The Portfolio of ITL shall be analysed by using the BCG matrix:
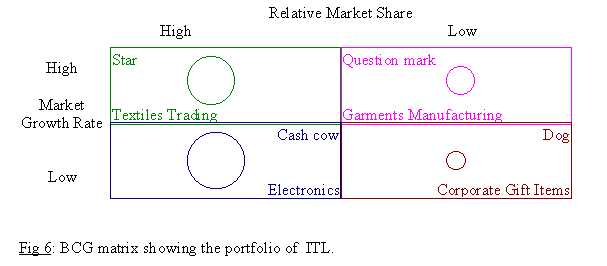
The company’s various business units are represented as circles on the matrix, with their diameters representing the sales of the business in relation to the sizes of other businesses in the portfolio.
The SBU dealing in corporate gift items is a dog. ITL’s low market share has primarily been due to the fragmented nature of the industry. The business has focused on providing a limited number of low-priced items. The use of cheaper raw materials to reduce costs has reduced the overall quality of the products and has increased wastage as well. The market growth rate is low as most of the small and medium businesses are still sceptical of the ideas of marketing communication through corporate gifts and view it as an unnecessary expenditure.
The electronics division is a cash cow. Currently electronics trading in the UAE is in a depression due to a number of reasons, such as, the decrease in the number of CIS tourists, market saturation, fluctuation in the Asian currencies exchange rates, parallel trade etc. The problem for ITL has become severe with the entry of numerous ‘fly-by-night’ operators selling low-priced South-east Asian brands; as well as the opening up of retailing outlets by the Japanese principals themselves.
The garments manufacturing unit poses a question mark for ITL. It acquired the unit with the prime aim of diversifying into a related area (garments) along with its principal business (textiles trading). The overall market growth rate is high especially due to the export opportunities. The relatively low market share of ITL can be identified to the following factors:
· A major part of the unit’s products are sold locally.
· The organisation has concentrated on manufacturing men’s wear, ignoring other high potential segments.
· It uses only those fabrics as raw materials which are supplied by its textile division.
· The marketing of the garments brand has been considerably ignored.
The textile trading unit still remains a star for ITL. During the early 1990s buyers from the CIS countries brought a boom in the market. Currently traders from Iran, Kuwait and African countries, mainly Kenya, Tanzania, Uganda, Zambia and Zaire have further increased the market growth rate. Gaining from its first mover advantage ITL set up a number of agencies with reputed manufacturers from Japan, China and more recently Thailand, Korea and India. This has helped it maintain its superior competitive position.
Having analysed the relative standing of each SBU in the group’s portfolio, the marketing implications of each shall be analysed.
+ In the corporate gift items unit the best option would be to withdraw / liquidate the business. The organisation has no competitive advantage in the activity and the business will at best only yield marginal profits. The low value, cheaper products offered by the unit will have little market share even in the future as small businesses (the unit’s main target market) mostly aim to make short term gains . Moreover with the increasing costs of doing business, small businesses will try to reduce their expenditure and marketing will focus more on price based promotions. Another important factor is that sales from medium and large scale businesses will be almost negligible as they would not want to ‘spoil’ their corporate image by giving inferior and low-value corporate gifts. Though this problem could be addressed by operational restructuring, the investment could be better directed to other SBUs.
+ For the electronics division, the best option would be to consolidate its position by increasing it’s marketing activity, emphasising quality of both products and service and cutting down costs. Such a strategy direction would on the one hand prevent its condition from deteriorating, and on the other hand would ensure adequate funds for supporting other SBUs. The reasons in support for this strategy are as follows:
· The UAE government in liaison with the Electronics Group has stated taking severe measures against parallel importing.
· The Forum of Electronics Distributors are taking several measures to check the dumping of illegal goods in the country.
· Direct actions are being taken against manufacturers to prevent ‘double dealing’.
· With the growth of shopping festivals throughout the emirates, the purchases by the price-sensitive, middle income group are bound to increase.
· Moreover, electronics being relatively high value items can also provide a good cash flow.
+ The star of the group i.e. textile trading represents the best profit and growth potential. To build on the established success the business should consider market development, especially in the upcoming African markets, by setting up regional offices. This proximity to its customers will give ITL a better insight into their customer’s ‘tastes and preferences’ and the business could soon internationalise on a bigger scale.
+ The garments manufacturing has failed primarily because the group has been unable to establish a ‘real synergy’ between the related SBUs of textile trading and garments manufacturing. The company should first consider the local distribution through it’s retail textile network. This would provide an opportunity to exploit new unexplored markets through its textile customers. The company could also do well by developing its product lines with a view to enter other segments, such as ladies or children’s wear. Moreover the unit should also consider manufacturing uniforms for business groups and schools. This ‘sub-segment’ activity is undertaken by small tailoring houses and is largely unexposed to large manufacturing units. By focusing on timely delivery, low-prices and superior quality management the SBU could soon turn into a bright star in this particular market.
All the above marketing implications have been analysed with respect to the present and future market scenarios. However, the application of the resultant strategies and it’s successes depend to a great extent on the management skill, resources, commitment and the cultural and political influences within the organisation.
Limitations of Portfolio Analysis
1. To begin with, the portfolio analysis requires a great deal of information about a wide range of variables. This requires considerably more time and effort than the concept suggests. Further, measurements and judgements are subjective in nature.
2. The relationship between market share and profitability may not be proportional. Late entrants may have lower cost of production because of advanced technology and deciding how much market share is sufficient in what industries is very difficult.
3. While comparing competitors one has to ensure that they serve the same clientele i.e. their strategic target market is the same.
4. The portfolio analysis overlooks the resources shared at each functional level, when market share is measured at the consumer end.
5. “Some of the BCG prescriptions could lead to a lack of innovative product introductions, since by definition new products start as dogs or question marks”. (Glueck, W. F. and Jaunch, L. R. , 1988, p270).
6. Higher growth markets may not always be the best because of the high entry costs and other barriers to entry. For example, aircraft manufacturing industry.
7. Competitive equilibrium in modestly growing markets may also provide huge returns. For example, inspite of the rivalry between Coke and Pepsi, both companies have been consistently profitable.
8. Even some dog units such as small consulting or advertising firms, of minute scale, enjoy reasonable success due to their flexibility and local adaptability.
9. In case on a share-momentum graph erratic valuations on an yearly basis may make the chosen time frame clumsy and the averages used may hide important facts.
10. The relationship between market share and profitability underlying the BCG matrix varies across industries and segments. “In some industries a large market share creates a major advantage in unit costs, in others it does not. Furthermore, some companies with low market share can generate superior profitability and cash flow with careful segmentation, innovation or differentiation. E.g. Mercedes-Benz and Polaroid”. (Pearce II, J. A. and Robinson, JR., R. B. , 1988, p276).
11. Portfolio analysis does not address how value is created across the divisions. It does not check the linkages between two or more business units which may complement each other. The only relationship addressed in the BCG is cash.
12. The portfolio analysis also suffers from the assumption that companies have to be self-sufficient in capital implying that they cannot generate additional funds from the capital market.
13. When considering market share or cash generation the portfolio analysis overlooks the SBU’s goodwill and the product’s brand equity. Moreover little quantitative attention is given to the risk factor.
14. Portfolio analysis does not address the difficulty of generating new internal growth opportunities. The generation of new businesses requires explicit emphasis on decisions regarding research and development, human resources, market research, only later to be followed by resource allocations.
15. “For the growth-share matrix to provide a clear representation of the profitability and competitive strength of each business, it is mandatory that each SBU be portrayed as independent and autonomous. If in reality they are not autonomous, then we will be misled and be faced with dogs in good health, cash cows with no milk, question marks without a question, and stars that don’t shine”. (Hax, A. C. and Majluf, N. S. , 1987, p198).
Developments in Portfolio Analysis
Several developments have been taking place in portfolio analysis which are not merely restricted to providing a snapshot of the present situation but also indicate historical changes and likely future scenarios. Some of the important developments in portfolio analysis are given below:
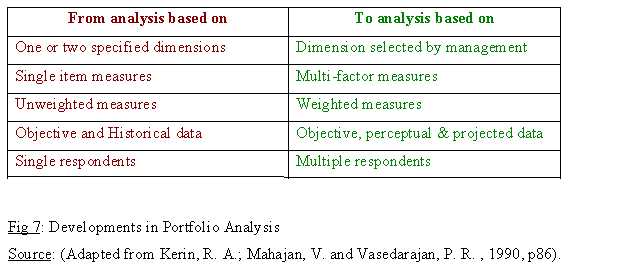
More importantly linkages between different strategic units are being analysed. Recently, firms have also used portfolio analysis to evaluate resource allocation across different technologies and ‘value-centres’. What should not be forgotten, however, is that such computer generated multi-dimensional analysis can only aid thinking, but cannot replace strategic thinking or strategic decision making.
Conclusion
Thus we can see that though certain pitfalls exist in the portfolio analysis techniques, they are still widely used. With the growing liberalisation of economies, international marketing activities are bound to grow. This will create a need to maintain a wide variety of portfolios, which in turn will require the analysis of a multitude of factors in markets more competitive than ever. The future will bring with it various challenges that will put to test the skills of corporate strategists anew. The success that a company gets will depend on the management’s ability to cope with the implications of the analysis. What is required is not merely the development of sophisticated analytic techniques, but a real commitment on the part of management to stretch the elegant theory into the complex reality of the new millennium.
BIBLIOGRAPHY
1. Aaker, D. A. (1998): “Developing Business Strategies” (5th Ed.) : John Wiley and Sons Inc.
2. Ackoff, R. L. (1981): “Creating the Corporate Future” : John Wiley and Sons.
3. Ansoff, H. I. (1979); “Strategic Management” : McMillan Publishers.
4. Cravens, D. W. (1997): “Strategic Marketing” (5th Ed.) : Irwin.
5. Glueck, W. F. and Jaunch, L. R. (1988): “Business Policy and Strategic Management” (5th Ed.) : McGraw Hill Ltd.
6. Hax, A. C. and Majluf, N. S. (1978): “A methodological approach for the development of strategic planning in diversified corporations’, in Hax, A. C. (ed.): “Studies in Operations Management”: North Holland, Amsterdam, pp41-58.
7. Hax, A. C. and Majluf, N. S. (1984): “The use of growth-share matrix in strategic planning” in Hax, A. C. (ed.) : “Readings on Strategic Management” : Balkinger Publishing Company.
8. Hax, A. C. and Majluf, N. S. (1987): “Competitive Cost Dynamics: The Experience Curve”, “Interfaces” Vol. 12, No. 5 (October 1987).
9. Higgins, J. M. and Vincze, J. W. (1993): “Strategic Management Concept” :The Dryden Press.
10. Johnson, G. and Scholes, K. (1993): “Exploring Corporate Strategy” (3rd Ed.) : Prentice Hall .
11. Kenny, B.; Sanderson, S. ; Lea, E. and Luffman, G. (1997): “Strategic Management - An Analytical Introduction” (3rd Ed.):Blackwell Publishers Limited.
12. Kerin, R. A.; Mahajan, V. and Vasadarajan, P. R. (1990): “Contemporary Perspectives- Strategic Market Planning” : Alyn and Bacon: Boston.
13. McNamee, P. (1998): “Strategic Market Planning - A Blueprint for Success” : John Wiley and Sons.
14. Pearce II, J. A. and Robinson, Jr., R. B. (1998): “Strategic Management - Strategy Formulation and Implementation” (3rd Ed.) ; Richard D. Irwin Inc.
15. Robson, W. (1994): “Strategic Management and information Systems- An Integrated Approach” : Pitman Publishing.
16. Slatter (1980): “Common pitfalls using the BCG product portfolio matrix”, “London Business School Journal”, Winter 1980.
17. Stacey, R. D. (1996): “Strategic Management and organisational Dynamics” (2nd Ed.): Pitman Publishing.
18. Thomson, J. L. (1997): “Strategic Management- Awareness and Change” (3rd Ed.) : International Thomson Business Press.
19. Walker, Jr., O. C.; Boyd, Jr., H. W. and Larreche, J. C. (1992): “Marketing Strategy- Planning And Implementation”: Richard D. Irwin Inc.
20. Wit, B. D. and Meyer, R. (1994): “Strategy Process, Content and Context- An International Perspective” : West Publishing Company.
MBA Assignments Academic Homepage